Commercial analytics / Packaging optimization
Pack Opportunity Analysis
Finding opportunities to improve profitability.
I built Power BI reporting and a Python/Streamlit application to identify where selling low-priced items in packs could reduce warehouse handling labor. Purchasing history helps teams assess potential profitability, customer fit, and next steps for each opportunity.
The business opportunity
How unit-level handling erodes margin.
Some low-priced items show a positive product margin but become unprofitable after individual picking and handling costs, even when customers regularly order several units at a time.
Packs could reduce repeated work, but only when the quantities fit how customers order. Storage constraints and vendor feasibility help determine which recommendations are worth pursuing.
Based on 2025 demand, we estimated approximately $8 million in potential annual warehouse handling-labor savings from moving suitable items into packs. Those savings could offset losses on some items and improve margins on others.
From discovery to action
Follow an opportunity through the tools.
See how the report identifies opportunities, the application helps evaluate them, and the action workflow supports follow-up. The interactive example uses invented orders and costs.
The decision journey
Choose a stage. On a desktop trackpad, you can also swipe horizontally across the showcase.
See the broader opportunity.
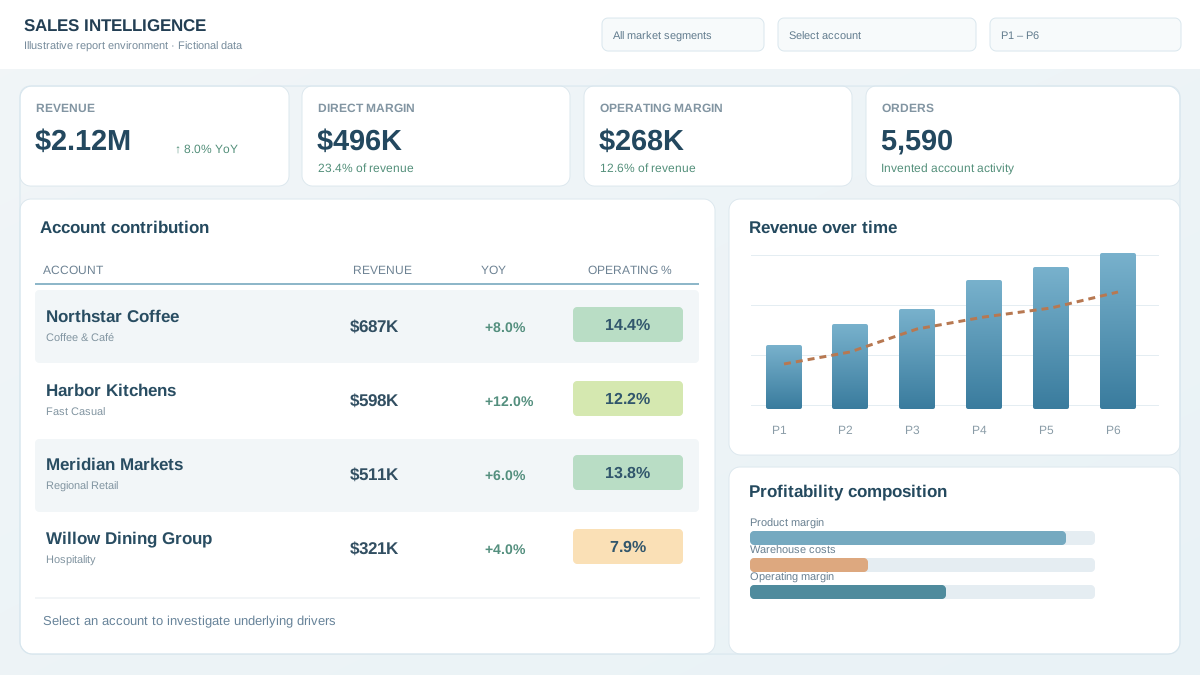
Start with account and item performance, modeled handling costs, and purchasing history to understand where a pack deserves attention.
Turn a signal into a review.
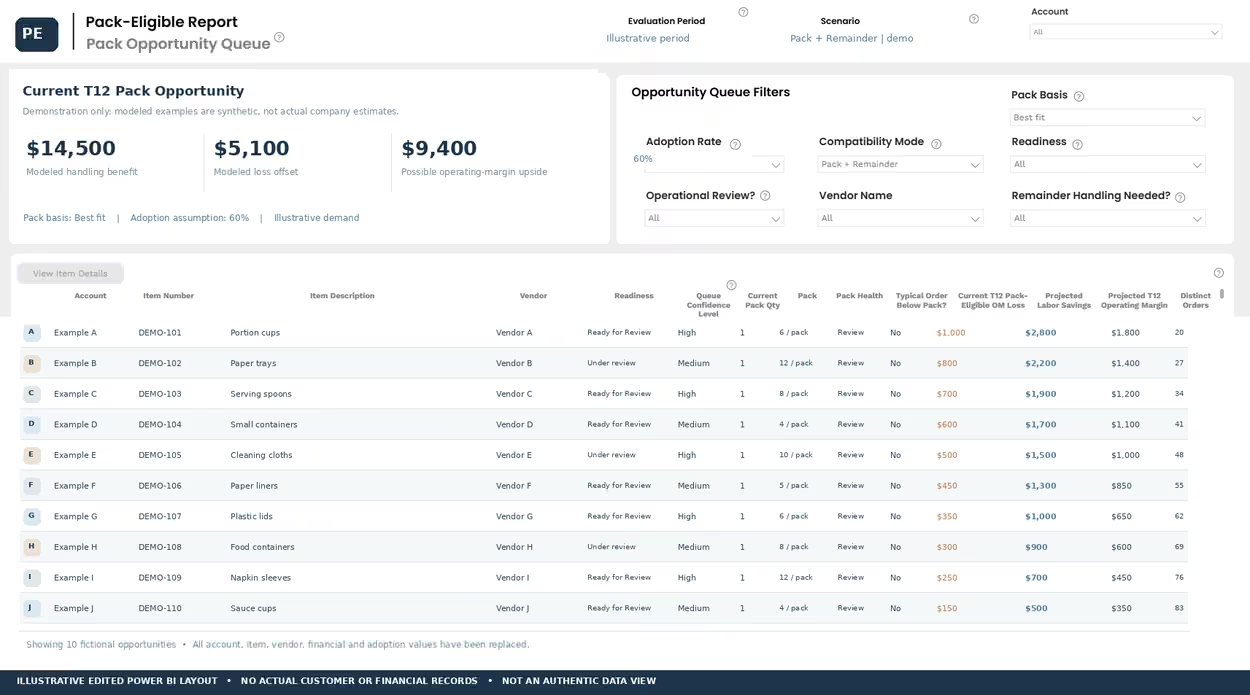
The working queue lets teams investigate a specific account-item opportunity, consider pack sizes against ordering habits, and track the next step.

These are workflow capabilities, not recreated screens or records from the application.
Test a pack opportunity yourself.
Compare fictional pack sizes, estimated labor effects, and an editable follow-up draft.
The Power BI and Streamlit images are sanitized real layouts. The interactive sandbox uses invented accounts, orders, and costs; it is not connected to a live system and does not demonstrate realized savings.
My contribution
I led the analytical design, built the Power BI report and Python/Streamlit application, and developed the recommendation logic and follow-up workflow. I also trained Business Relations and account owners to evaluate opportunities and use the tools.
Decision Studio / Continue exploring